
"Python is the data scientist's favorite tool — readable enough for beginners, powerful enough for real analysis."
Learning Objectives
By the end of this module, you will be able to:
- Say why Python is so popular in data science
- Recognize the key data libraries
- Understand what a notebook is
- Read a tiny data-analysis snippet
1. Why Python?
Python reads almost like English, has a gentle learning curve, and — crucially — a huge ecosystem of free tools built for data.
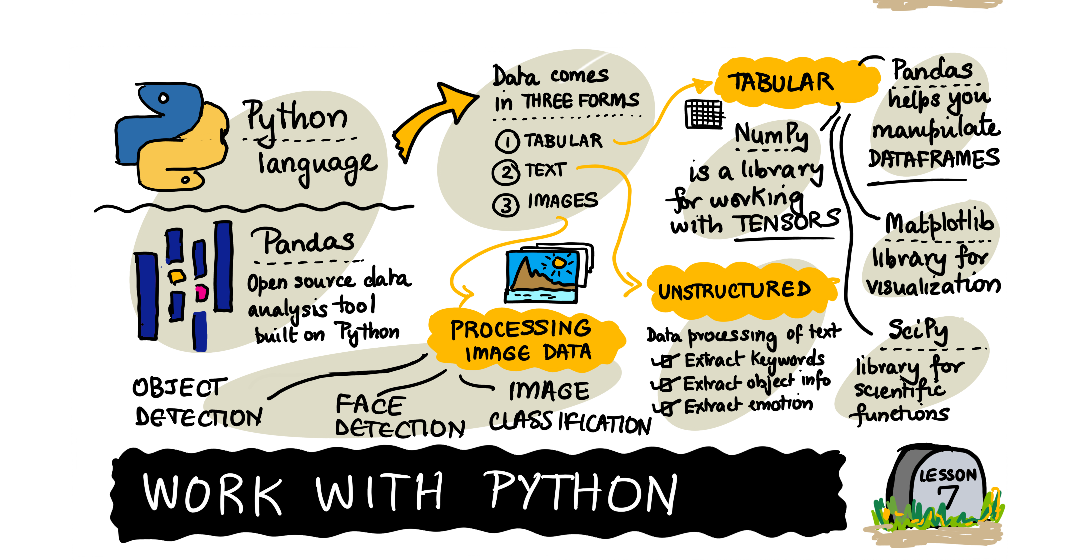
Key idea: You rarely write everything from scratch in data science. You lean on libraries — pre-built toolkits — so a few lines of Python can load, clean, and chart thousands of rows.
Explain like I'm new: A library is like a kitchen full of ready-made appliances. You don't build a blender from raw metal every time you want a smoothie — you press a button. In Python, importing a library gives you powerful "appliances" for data, so you focus on the recipe, not the wiring.
2. The Essential Libraries
| Library | What it does |
|---|---|
| pandas | Work with tables (rows & columns) |
| NumPy | Fast math on numbers and arrays |
| Matplotlib / Seaborn | Make charts |
| scikit-learn | Machine learning models |
These four cover most of the daily workflow. pandas is the one you'll reach for constantly — it turns a messy CSV into a tidy table you can filter, group, and summarize in one line. NumPy quietly powers pandas under the hood with fast number-crunching, while Matplotlib/Seaborn turn results into charts and scikit-learn waits for when you're ready to predict, not just describe.
Common mistake: Believing you must "learn all of Python" before touching data. In practice, most data work uses a small slice of the language — variables, lists, loops, and calling library functions. You can be productive with pandas long before you've mastered Python as a whole, so start with real data early rather than waiting.
3. Notebooks
Data scientists often work in Jupyter notebooks — documents that mix live code, its output (tables, charts), and notes. You run one small chunk at a time and see results instantly, which is perfect for exploring.
Simple example: Loading and peeking at data is just two lines with pandas:
[object Object], pandas ,[object Object], pd
df = pd.read_csv(,[object Object],)
df.head()        ,[object Object],
The magic of a notebook is the fast feedback loop. Instead of writing an entire program and running it at the end, you try one idea, see the table or chart appear directly beneath your code, adjust, and try again — a conversation with your data rather than a monologue. Notebooks also double as a report: because code, results, and your written notes all live in one document, you can hand the whole notebook to a colleague and they can follow your reasoning step by step, not just read the final answer.
Concept: In pandas, a table is called a DataFrame (df for short by convention). Almost everything you do — filtering, grouping, charting — happens on a DataFrame, so getting comfortable with it is 80% of the job.
4. A Tiny Analysis
df[,[object Object],].mean()              ,[object Object],
df.groupby(,[object Object],)[,[object Object],].,[object Object],()   ,[object Object],
Two short lines answer real questions — that's the power of pandas. The second line especially shows the pattern you'll use endlessly: split the data into groups (by city), apply a calculation to each group (sum the revenue), and combine the answers into a neat table. That "group-by" move turns a giant list of transactions into a clear per-city summary in a single readable line. Notice too how readable the code is — even without knowing Python, you can almost guess that the first line takes the average revenue. That readability is exactly why the language won over data scientists.
This same handful of steps scales up too. Whether you have 50 rows or 50 million, the pandas code barely changes — groupby and mean work the same way. That's the quiet superpower of these libraries: the effort you spend learning them on a tiny practice file pays off unchanged on real, large datasets later.
Data scientist tip: Don't try to memorize every function. Learn the shape of the workflow (load → explore → clean → analyze → chart) and look up specifics as you go. Every professional keeps the docs open.
Try this: Install Python and open a free notebook (Google Colab needs no setup). Load any CSV with two lines like the ones above and call df.head(). Seeing your own data appear instantly is the moment data science stops feeling abstract.
Key Takeaway: Python is popular in data science for being readable and backed by powerful free libraries — pandas (tables), NumPy (math), Matplotlib/Seaborn (charts), and scikit-learn (ML). Data scientists explore in Jupyter notebooks, running small code chunks and seeing results instantly. Learn the workflow, not every function.
Further Learning
Adapted from Microsoft's Data Science for Beginners (MIT License). Sketchnote by Nitya Narasimhan.