
"Real-world data is messy. Cleaning it isn't glamorous — but it's where most of the real work (and most of the value) lives."
Learning Objectives
By the end of this module, you will be able to:
- Explain why data needs cleaning
- Recognize common data problems
- Follow a basic cleaning workflow
- Understand transformations
1. Why Clean Data?
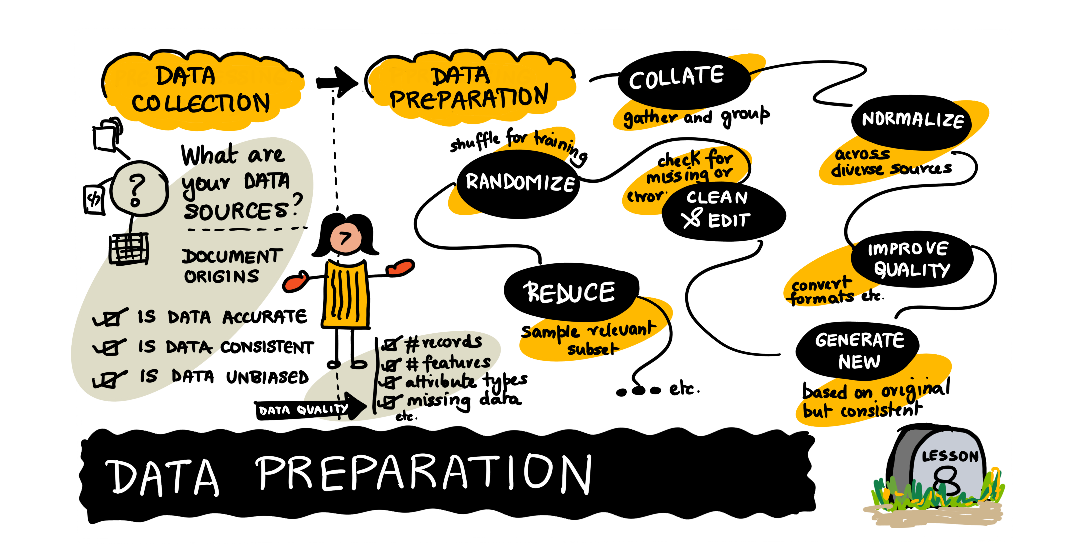
Raw data arrives with typos, blanks, duplicates, and inconsistent formats. Feed messy data into an analysis and you get a messy answer — garbage in, garbage out. The tricky part is that messy data rarely announces itself: a chart still draws, an average still calculates, a total still appears. The numbers just happen to be wrong. Cleaning is how you earn the right to trust the answer at the end.
Key idea: Data cleaning often takes the majority of a project's time. It's not busywork — clean data is the single biggest factor in whether your results are trustworthy.
Explain like I'm new: Cleaning data is like prepping ingredients before you cook. You wash the vegetables, cut off the bad bits, and measure everything out. Skip that prep and even a great recipe turns out wrong. The tidying feels tedious, but it's what makes the final dish (your analysis) actually good.
2. Common Problems
| Problem | Example |
|---|---|
| Duplicates | The same customer listed twice |
| Inconsistent formats | "USA", "U.S.A.", "United States" |
| Wrong types | Numbers stored as text |
| Typos | "Pariss" instead of "Paris" |
| Missing values | Empty cells (Module 11) |
Each of these quietly breaks something. Duplicates inflate your counts. Inconsistent labels split one real category ("USA") into several fake ones, so no total is correct. "Wrong types" is a sneaky one: a price stored as the text "3.50" can't be added up until you convert it to a number — the computer sees characters, not money.
Real-world use case: An analyst counted customers by country and reported 40 markets — but the true number was 25. The list had "UK," "U.K.," and "United Kingdom" as three separate entries, plus a few trailing spaces the eye couldn't see. Standardizing the labels collapsed the phantom markets into real ones, and the corrected count changed which regions the company chose to invest in.
Common mistake: Trusting that a dataset is clean just because it opens neatly in a spreadsheet. A tidy-looking grid can still hide duplicate rows, text-that-should-be-numbers, and five spellings of the same city. Looks are not proof of quality.
3. A Basic Cleaning Workflow
- Look at the data —
df.head(),df.info() - Fix formats — standardize text, convert types
- Remove duplicates
- Handle missing values (next module)
- Check the result looks sensible
The first and last steps matter most and get skipped most. Looking first tells you what you're dealing with before you touch anything; checking afterward catches the mistakes cleaning itself can introduce. A good rhythm is: look, make one change, look again — small steps you can verify beat one giant transformation you can't.
Simple example: Standardizing a country column: convert everything to lowercase and map variations to one label, so "USA", "usa", and "United States" all become a single consistent value you can count correctly.
4. Transformations
Sometimes you reshape data to make it usable — combining columns, splitting a full name into first/last, or converting units. These transformations get data into the shape your analysis needs.
Real-world use case: A sales file lists dates as text like "2026/07/06". Before you can chart sales by month, you transform that text into a real date, then extract the month. One preparation step unlocks a whole category of time-based questions you couldn't ask before.
Data scientist tip: Write your cleaning as repeatable code, not one-off manual edits in a spreadsheet. When next month's file arrives with the same problems, you re-run the script in seconds instead of cleaning by hand all over again — and a script also serves as a written record of exactly what you did.
Common mistake: Cleaning without keeping the original. Always work on a copy so you can trace what you changed and undo mistakes. Document your steps — future-you will be grateful.
There's a balance to strike, too: clean enough to trust your results, but resist "polishing" forever. Perfectly pristine data doesn't exist, and past a point, extra scrubbing adds little while eating all your time. Fix what would actually distort your answer, note what you left, and move on to the analysis.
Try this: Open any messy spreadsheet you own and hunt for just three issues from the table above — a duplicate, an inconsistent label, a number stored as text. Spotting them by eye is the first skill; fixing them in code comes naturally after.
Key Takeaway: Real data is messy (duplicates, inconsistent formats, wrong types, typos, blanks), and cleaning it is most of a data project — because clean data drives trustworthy results. Follow a workflow: look, fix formats, de-duplicate, handle missing values, and verify. Reshape with transformations, and always keep the original.
Further Learning
Adapted from Microsoft's Data Science for Beginners (MIT License). Sketchnote by Nitya Narasimhan.