
"Before you analyze data, you need to know what kind of data you have. Different data calls for different tools."
Learning Objectives
By the end of this module, you will be able to:
- Say what "data" actually is
- Tell structured from unstructured data
- Tell quantitative from qualitative data
- Recognize common data sources
1. What Is Data?
Data is simply recorded facts — numbers, words, clicks, images, sensor readings. On its own it's raw; data science gives it meaning.
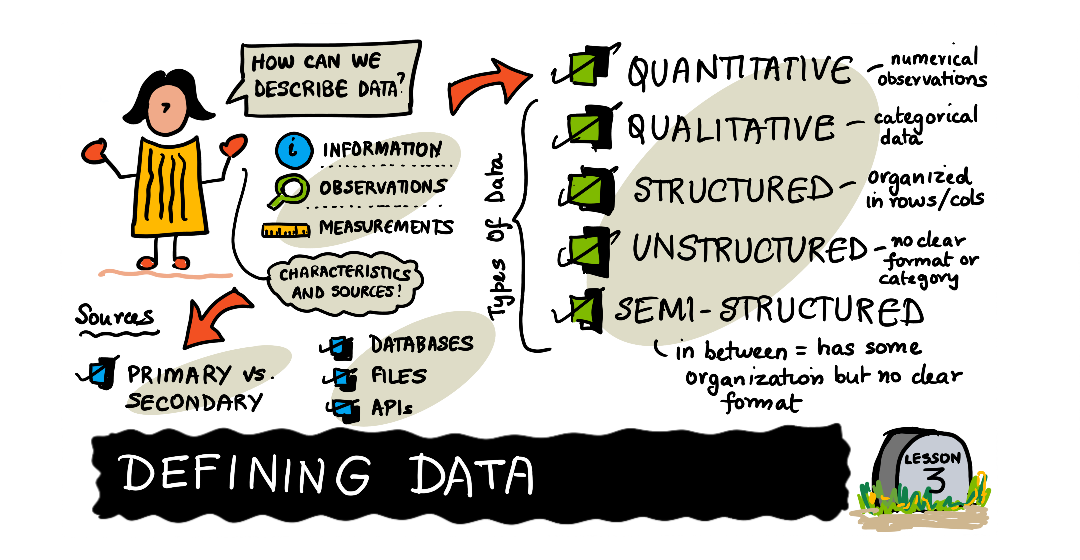
Almost anything can become data the moment it's recorded. The temperature outside, the time you woke up, the emoji you sent, a doctor's handwritten note — all of it is data waiting to be organized. The important shift in thinking is realizing that the world is full of data, and a data scientist's first job is often just deciding which pieces are worth capturing.
Explain like I'm new: A single fact — "it was 22°C at 9 a.m." — is one data point. Collect thousands of them and you have a dataset, which is where patterns (like "mornings are getting warmer") start to appear.
2. Structured vs. Unstructured
| Type | What it looks like | Examples |
|---|---|---|
| Structured | Neat rows and columns (a table) | Spreadsheets, databases |
| Unstructured | No fixed format | Emails, photos, videos, social posts |
| Semi-structured | Some organization, flexible | JSON, log files |
Key idea: Structured data fits in a spreadsheet; unstructured data (text, images, audio) doesn't. Most of the world's data is unstructured — which is exactly why it's valuable and challenging.
Why does this matter so much? Because the type decides the tool. Structured sales data slides straight into a spreadsheet or database and you can sum it in seconds. A folder of customer photos or a pile of support emails needs very different techniques (often the machine-learning tools you'll meet later) just to become countable. Knowing the type up front saves you from reaching for the wrong tool.
Real-world use case: A company's structured data (order totals) tells them how much customers spent. Their unstructured data (product reviews and support chats) tells them why customers were happy or angry. The richest insights often come from combining both.
3. Quantitative vs. Qualitative
- Quantitative — numbers you can measure or count (height, price, temperature)
- Qualitative — descriptions and categories (color, mood, country)
Simple example: For a cup of coffee: price ($3.50) and temperature (65°C) are quantitative; flavor notes ("nutty, sweet") and size label ("medium") are qualitative.
A useful test: if it makes sense to do arithmetic on it (an average, a total), it's quantitative; if it only makes sense to group or count categories, it's qualitative. "Average price" is meaningful; "average color" is not — but "the most common color" is. Getting this right early prevents nonsense calculations later, because the type of a value quietly decides which summaries and charts are even allowed.
4. Where Data Comes From
- Collected directly — surveys, forms, experiments
- Generated automatically — apps, sensors, website logs
- Public datasets — governments, research, open data portals
- Third parties — APIs and data providers
Always note the source — it affects trust and quality (Module 3). Data you collect yourself is usually the most trustworthy because you control how it was gathered, but it's slow and limited. Public and third-party data is fast and vast, but you must ask how it was collected before you rely on it.
Common mistake: Grabbing a convenient dataset without checking who created it or when. Old, biased, or badly collected data will quietly poison every conclusion you draw from it — no amount of clever analysis can fix a bad source.
Data scientist tip: Whenever you receive a new dataset, jot down three things before touching it: who created it, when, and why. Those three notes protect future-you from trusting stale numbers or a source that was never meant to answer your question in the first place.
Try this: List three pieces of data your phone generated today (steps, screen time, location pings). For each, guess whether it's structured or unstructured and quantitative or qualitative. You'll classify data the way a professional does.
Key Takeaway: Data is recorded facts. It's structured (tables), unstructured (text/images/video — the majority), or semi-structured (JSON). Values are quantitative (numbers you measure) or qualitative (categories/descriptions). Data comes from direct collection, automatic generation, public datasets, and third parties — and its source shapes its trustworthiness.
Further Learning
Adapted from Microsoft's Data Science for Beginners (MIT License). Sketchnote by Nitya Narasimhan.