"A time series is a story told in order. Forecasting is reading that story closely enough to guess the next chapter."
Learning Objectives
By the end of this module, you will be able to:
- Explain what a time series is and why order matters
- Recognize trend and seasonality in data
- Understand, in plain words, what ARIMA does
- Describe real problems solved by forecasting
- See why time series needs special treatment
1. The Crystal Ball
Time series forecasting is machine learning's crystal ball: using the past behavior of something measured over time to predict its future values.
The source curriculum uses a great real example: electricity demand — three years of hourly power-usage data. Given how much electricity a city used in the past, can we predict how much it'll need next hour? Utilities live and die by this: guess too low and the lights flicker; guess too high and you waste money.
Picture a row of smart parking meters. If you could forecast when demand spikes, you could plan staffing, cleaning, and pricing around it. That's forecasting turning history into foresight.
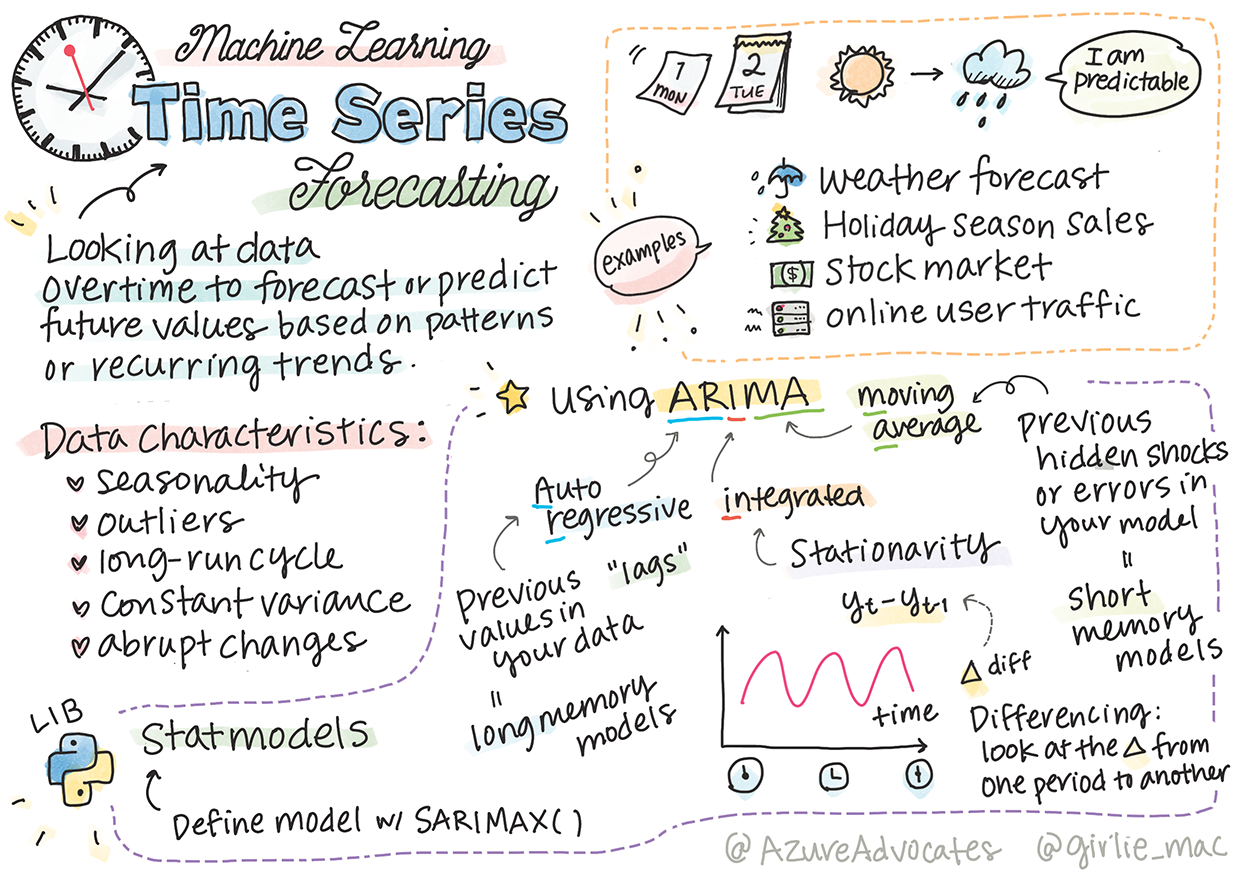
Concept: A time series is simply data points listed in time order — hourly electricity, daily stock prices, monthly sales. The defining feature is that when each point happened is part of the data.
2. What Makes Time Series Special
Here's the crucial difference from every earlier module: order matters, and you can't shuffle it.
With pumpkin prices or cuisines, you could jumble the rows and nothing changed. But a time series is a sequence — Tuesday comes after Monday, and last hour influences this hour. Scramble it and you destroy the very pattern you're trying to learn.
Warning: That train/test split from Module 3 needs a tweak here. You can't randomly shuffle time-series data into train and test sets — that would let the model "peek" at the future to predict the past! Instead, you train on earlier data and test on later data, respecting the arrow of time.
3. Trend and Seasonality
Most time series are built from two repeating ingredients, and spotting them is half the battle:
| Pattern | What it is | Example |
|---|---|---|
| Trend | The long-term direction | Electricity use slowly rising year over year |
| Seasonality | Regular, repeating cycles | Demand peaking every evening; sales spiking every December |
Real data usually mixes both — a steady upward trend plus a daily and yearly rhythm riding on top. A good forecast learns each piece.
Concept: Think of a time series as music: the trend is the slow melody drifting up or down, while seasonality is the repeating beat. Forecasting means hearing both at once.
4. ARIMA, Without the Fear
The classic forecasting workhorse has an intimidating name: ARIMA — AutoRegressive Integrated Moving Average. Don't panic. Broken into plain English:
- AutoRegressive (AR): predict the next value using recent past values ("tomorrow looks a lot like the last few days").
- Integrated (I): focus on the changes between points, which helps handle trends.
- Moving Average (MA): learn from recent prediction errors to correct course.
Put together, ARIMA relates the present value of a series to its past values and its past mistakes — a smart, self-correcting way to extend the story forward.
Did You Know? Even in an age of flashy deep learning, classic methods like ARIMA remain workhorses for forecasting. When your data is a clean sequence of numbers over time, these time-tested models are often more accurate, faster, and far easier to explain than a giant neural network.
5. Building One in Practice
Conceptually, forecasting still follows a fit-then-predict shape — you fit a model to the historical sequence, then ask it for the next step:
[object Object], statsmodels.tsa.arima.model ,[object Object], ARIMA

model = ARIMA(history, order=(,[object Object],, ,[object Object],, ,[object Object],))   ,[object Object],
fitted = model.fit()                       ,[object Object],
forecast = fitted.forecast(steps=,[object Object],)        ,[object Object],
You'd then compare the forecast against the later data you held back, exactly as honest evaluation demands.
6. Where Forecasting Lives
Time series forecasting quietly runs much of the economy:
- Energy: predicting power demand hour by hour
- Retail: forecasting sales to manage inventory and staffing
- Finance: modeling prices and risk over time
- Supply chain: anticipating demand to avoid shortages
- Weather & climate: the original forecasting problem
Try This! Pick something in your life that changes over time — your daily steps, coffee spending, hours of sleep. Sketch a month of it. Can you spot a trend (drifting up or down) or seasonality (a weekday-vs-weekend rhythm)? You're now reading data the way a forecaster does.
Key Takeaway: Time series is data in time order, where sequence itself carries meaning — so you never shuffle it, and you test on the future, not random rows. Forecasts are built from trend (long-term direction) and seasonality (repeating cycles), and the classic ARIMA model predicts ahead using past values and past errors. It powers energy, retail, finance, and beyond.
This module is adapted from Microsoft's open-source ML-For-Beginners curriculum (MIT License). Time series sketchnote by Tomomi Imura (CC BY-SA 4.0).