"Sometimes there are no labels, no right answers to learn from — just a pile of data. Clustering finds the natural groups hiding inside it."
Learning Objectives
By the end of this module, you will be able to:
- Explain the difference between supervised and unsupervised learning
- Describe what clustering does and where it's useful
- Walk through how the K-Means algorithm works, step by step
- Use the "elbow method" to choose the number of clusters
- Recognize clustering at work in the real world
1. Learning Without a Teacher
Everything so far — regression, classification — was supervised learning: we had labeled examples (prices, cuisines) to learn from. But what if your data has no labels at all? Just a big pile of information and no answer key?
That's unsupervised learning, and clustering is its most popular form. Instead of being told the groups, the machine discovers them by noticing which things are similar.
You do this constantly. Sorting a pile of laundry into "socks," "shirts," and "jeans" — nobody labeled them, you just grouped by similarity. Organizing a messy sock drawer. That instinct to bring order to chaos is exactly what clustering automates.
Concept: In supervised learning you learn from labeled examples ("this is a cat"). In unsupervised learning there are no labels — the algorithm groups the data by similarity on its own. Clustering makes sense of data before you even know what questions to ask.
The source curriculum explores a fun dataset here: Nigerian music, grouping songs by their audio features to reveal genres and listening patterns.
2. Where Clustering Shines
Clustering quietly powers a lot of the world:
- Customer segmentation — grouping shoppers by behavior so a business can tailor offers
- Fraud & anomaly detection — a transaction that fits no normal cluster is a red flag
- Medical imaging — grouping similar scans to spot the unusual one
- Search & recommendations — grouping similar articles, images, or products
- Privacy — referring to someone by their cluster instead of their personal details
Did You Know? Cluster analysis didn't start in computer science at all — it grew out of anthropology and psychology in the 1930s, as researchers looked for ways to group people by shared traits. The math found a whole new life once computers could crunch big datasets.
3. K-Means, Step by Step
The most popular clustering method is K-Means. The "K" is simply how many groups you want. Here's the whole algorithm in plain steps:
- Choose K — decide how many clusters (say, 3).
- Drop K centers — scatter 3 "center" points randomly among the data.
- Assign — attach each data point to its nearest center.
- Recenter — move each center to the average position of its points.
- Repeat steps 3–4 until the centers stop moving.
When the centers settle, you have your clusters. Each center is called a centroid — the heart of its group.
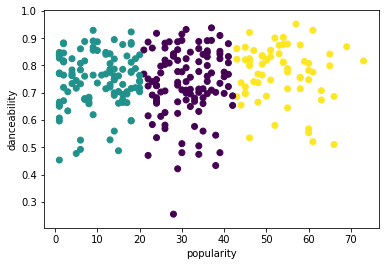
Concept: K-Means works by a tug-of-war that always settles: points pull toward the nearest center, then centers drift to the middle of their points. Round after round, the groups sharpen — until nothing wants to move. That stable resting point is your answer.
4. How Many Clusters? The Elbow Method
K-Means needs you to pick K up front — but how do you know the right number? A neat trick called the elbow method helps.
You run K-Means for several values of K and measure how "tight" the clusters are each time. Plot those numbers and the line usually bends sharply — like an elbow. That bend is the sweet spot: enough clusters to be meaningful, not so many that you're splitting hairs.
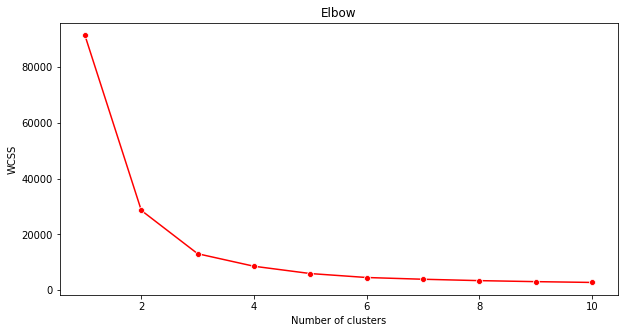
Pro Tip: More clusters always look "tighter" on paper (with enough groups, every point is its own cluster!). The elbow method stops you from over-splitting by finding where adding another cluster stops helping much. Trust the bend, not the biggest number.
5. Building One in Practice
As always, the code mirrors the familiar Scikit-learn rhythm — just note there's no y (no labels!):
[object Object], sklearn.cluster ,[object Object], KMeans

model = KMeans(n_clusters=,[object Object],)   ,[object Object],
model.fit(X)                   ,[object Object],
groups = model.predict(X)      ,[object Object],
Notice what's missing: there's no y_train. That's the signature of unsupervised learning — the data speaks for itself.
Try This! Look around your room and pick ~10 objects. How would you cluster them — by color? size? purpose? Now imagine choosing a different number of groups (2 vs. 5). Notice how the "right" number of clusters depends on what you care about. That judgment call is exactly what the elbow method helps with.
Key Takeaway: Clustering is unsupervised learning — it finds natural groups in unlabeled data by similarity. K-Means is the go-to method: pick K, drop centers, assign points, recenter, repeat until stable. The elbow method helps choose K, and in code there's no y because there are no labels. It powers customer segmentation, fraud detection, and more.
This module is adapted from Microsoft's open-source ML-For-Beginners curriculum (MIT License).