"You can't fix what you can't see. Application Insights shows how your deployed app is really behaving — speed, errors, and usage."
Level: Beginner · Time: ~2 days · Prerequisites: Module 8
Learning Objectives
By the end of this module, you will be able to:
- Explain why monitoring matters after deployment
- Understand what Application Insights captures
- Open your app's dashboards with
azd monitor - Recognize key signals to watch
1. Deployment Is Not the Finish Line
Shipping an app is the start of its life, not the end. In production it faces real users, real load, and real failures — a slow query under Monday-morning traffic, a dependency that times out, a memory leak that only shows after hours of uptime. None of that appears on your laptop. Monitoring gives you eyes on all of it, so you learn about problems from a dashboard — not from an angry user or a one-star review.
Concept: Without monitoring you're flying blind. "It deployed fine" says nothing about whether it's fast, reliable, or even working for users right now.
2. What Application Insights Captures
Azure Application Insights automatically collects telemetry from your running app:
| Signal | Tells you |
|---|---|
| Requests & latency | How many requests, how fast |
| Failures & exceptions | What's breaking, and where |
| Dependencies | Calls to databases, APIs, models |
| Usage | Which features people actually use |
Many azd templates provision Application Insights and wire it to your app automatically — the connection string is injected as an environment variable, so telemetry starts flowing from the very first request without any extra code from you.
Explain like I'm new: Application Insights is a fitness tracker for your app. It quietly records the app's heart rate (requests), stumbles (errors), and habits (usage) so you can spot trouble and trends.
3. azd monitor
azd gives you a shortcut straight to the dashboards:
azd monitorThis opens the monitoring views for your deployed environment — no hunting through the portal, no copying resource names. Because azd already knows which resources belong to your environment, it takes you straight to this app's dashboards. From there you can watch live metrics, drill into a single failing request to see its full stack trace, or trace a slow dependency call end to end.
Try this: After deploying a template with monitoring, run azd monitor, then hit your app a few times. Watch the requests appear on the dashboard in near real time — your app is talking back.
4. Signals Worth Watching
Don't drown in data — watch a few high-value signals:
- Error rate — a sudden spike means something broke.
- Latency (p95/p99) — slow tails frustrate users.
- Dependency failures — often the real root cause.
- Traffic — unexpected surges or drops.
Common mistake: Only checking dashboards after users complain. Set up alerts on key signals (error rate, latency) so Azure notifies you the moment something crosses a threshold — before it becomes a crisis.
5. Monitoring for AI Apps
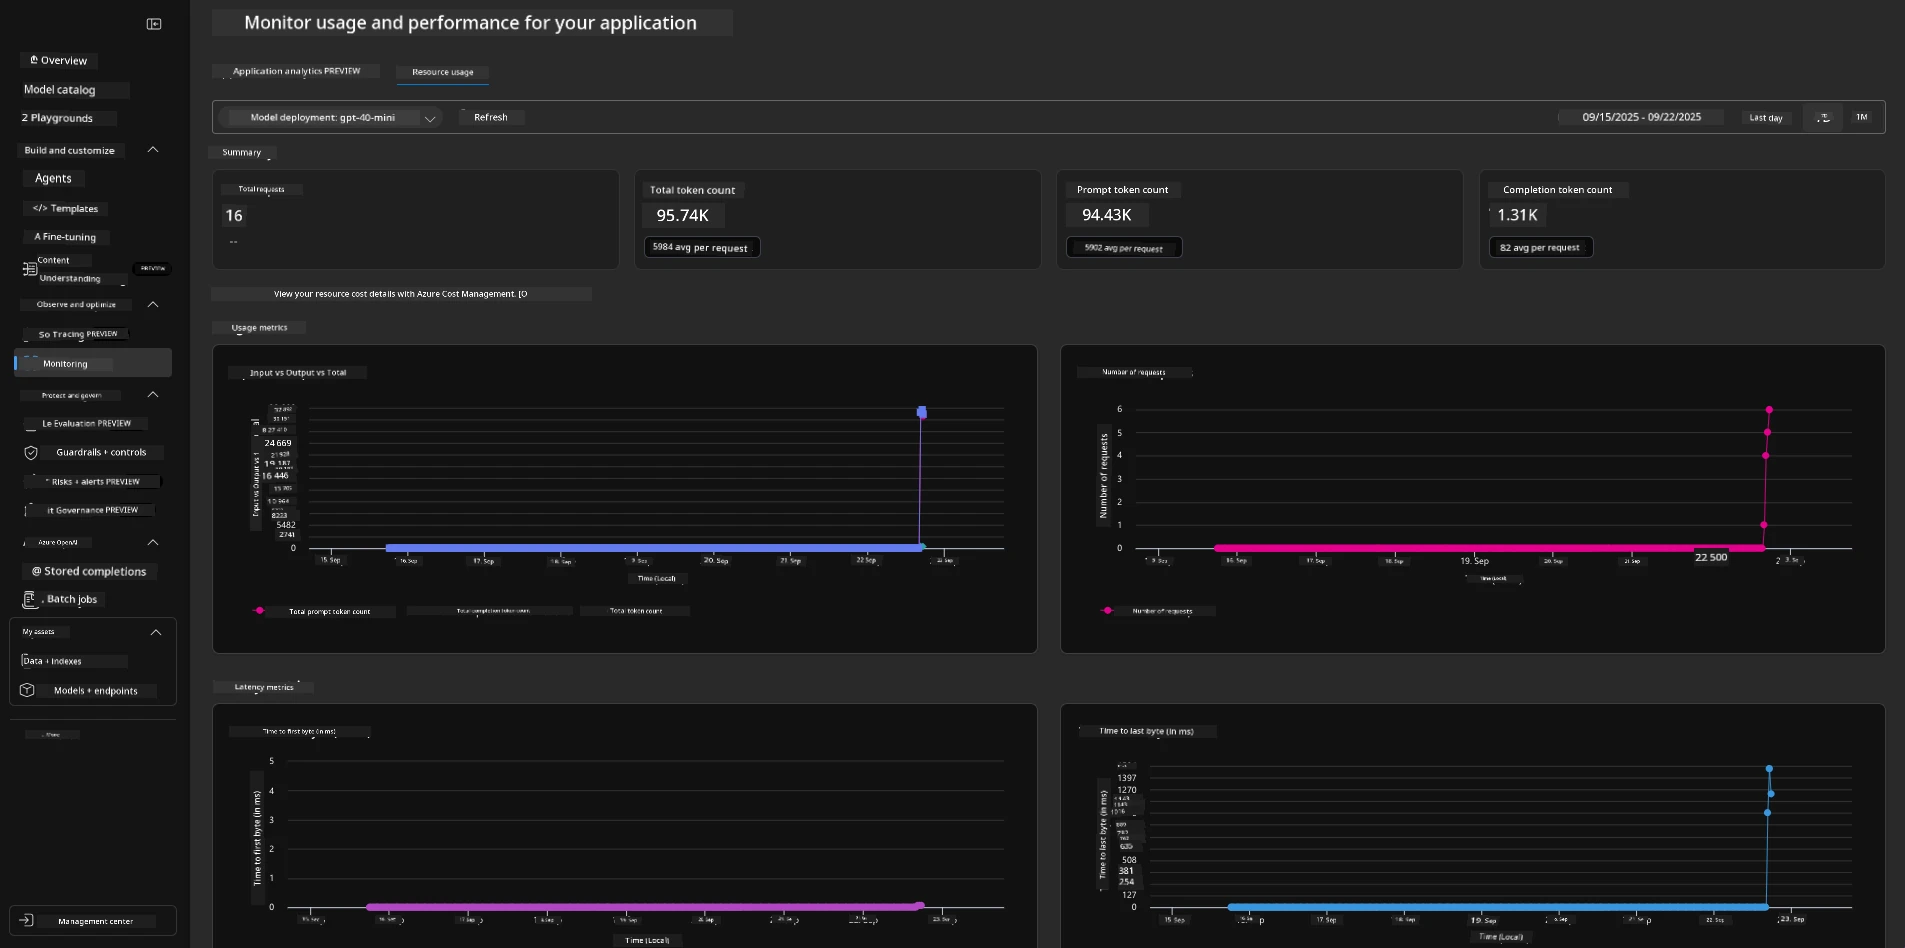
AI apps add signals worth tracking: token usage (which drives cost), model latency, and failure/refusal rates. Application Insights can capture these too, so you can watch spend and quality, not just uptime. A quiet climb in tokens per request, for example, can double your bill without a single error showing up — the app looks "healthy" but is quietly getting expensive, and only the AI-specific signals reveal it.
Real-world use case: A team's azd monitor dashboard shows latency creeping up after a release. They trace it to a slow database call, fix the query, redeploy with azd deploy, and watch latency drop — a full observe-diagnose-fix loop.
✅ Checkpoint
- Why isn't deployment the end of the job?
- Name three things Application Insights captures.
- What does
azd monitordo?
Answers: 1) In production the app meets real users, load, and failures — you need monitoring to know it's actually healthy. 2) Any three: requests/latency, failures/exceptions, dependency calls, usage (and for AI, token usage). 3) Opens the monitoring dashboards for your deployed environment.
Key Takeaway: Monitoring turns "it deployed" into "it's actually healthy." Application Insights (often auto-provisioned by azd templates) captures requests, latency, failures, dependencies, and usage — plus AI signals like token spend. Open it fast with azd monitor, watch high-value signals like error rate and latency, and set alerts so you catch problems before users do.
Further Learning
Part of "AZD for Beginners." Adapted from Microsoft's open AZD curriculum (MIT License).